As the U.S. restaurant industry enters 2026, it has largely completed its transition from post-pandemic recovery to structural normalization.
Total industry sales continue to grow, yet the nature of competition is fundamentally changing.
Multiple industry studies now point to a shared conclusion:
This report synthesizes insights from leading research institutions—including the National Restaurant Association (NRA), U.S. Bureau of Labor Statistics (BLS), McKinsey, PwC, Deloitte, and OpenTable—to examine how efficiency, guest experience, and operating structure must be rebalanced in the next phase of industry evolution.
Industry Overview: Growth Continues, but the Rules Are Changing
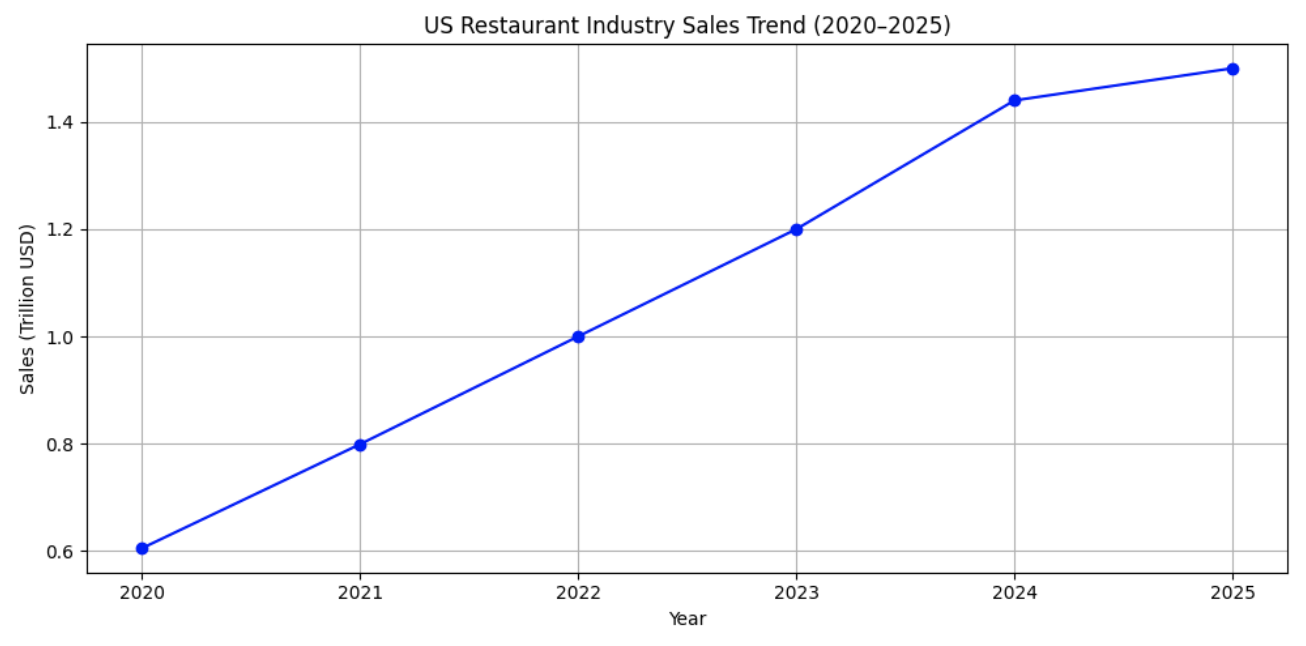
U.S. Restaurant Industry Sales Trend (Indexed, 2020–2025)
At a macro level, the U.S. restaurant industry remains on a steady growth trajectory.
However, unlike the rapid rebound seen in the immediate post-pandemic years, current growth is defined by:
- Slower, more stable expansion
- Fragmented demand across channels
- Rising complexity at the unit level
According to the National Restaurant Association, the industry is shifting from a scale-driven phase to a structure-driven phase of competition.
In practical terms, this means:
Consumer Behavior: Experience and Convenience Are Here to Stay
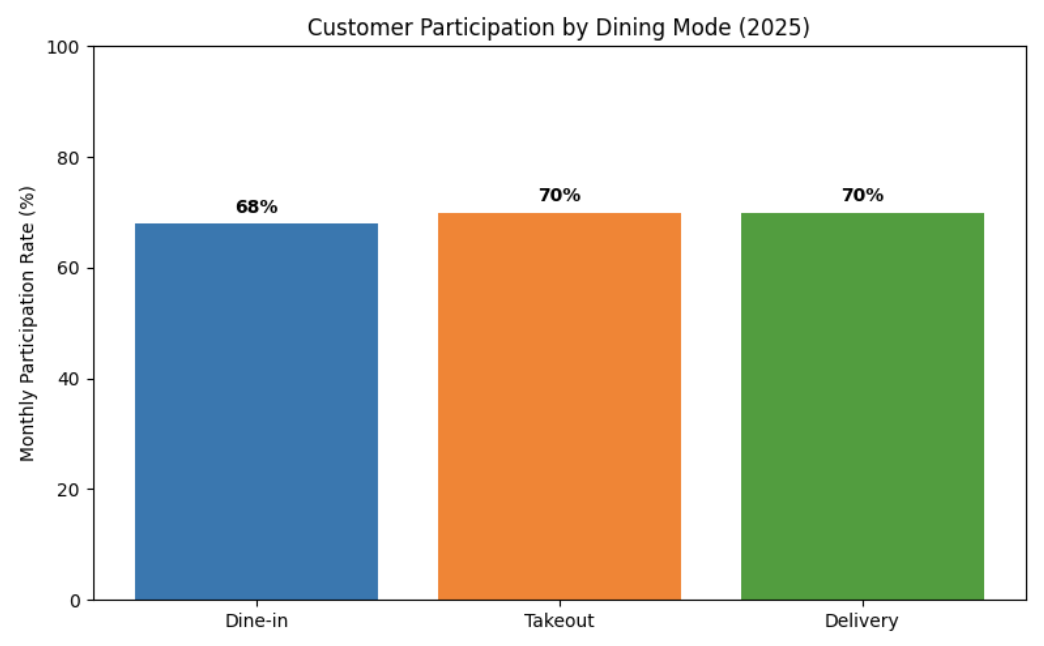
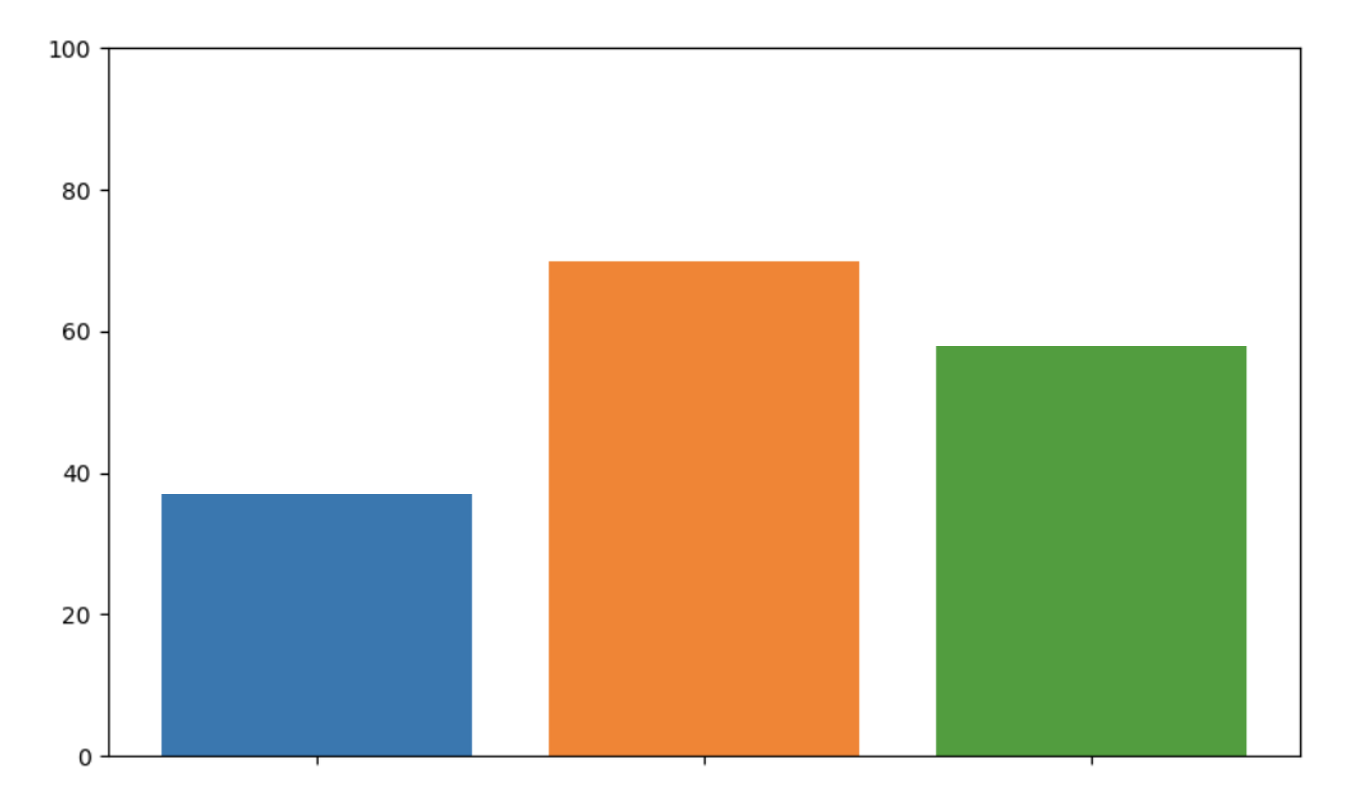
Customer Participation by Dining Mode (2025)
A common misconception is that consumers are “returning to normal” dining patterns.
In reality, research from PwC and McKinsey shows that consumer behavior has evolved into a multi-scenario model.
- Dine-in occasions are increasingly tied to social connection, celebration, and experiential value
- Off-premises orders serve convenience, predictability, and time efficiency
Importantly, these behaviors coexist within the same customer.
| Age | Dine-in (%) | Takeout (%) | Delivery (%) |
|---|---|---|---|
| 18–24 | 58 | 75 | 80 |
| 25–34 | 60 | 78 | 82 |
| 35–44 | 64 | 72 | 76 |
| 45–54 | 67 | 68 | 70 |
| 55+ | 58 | 55 | 49 |
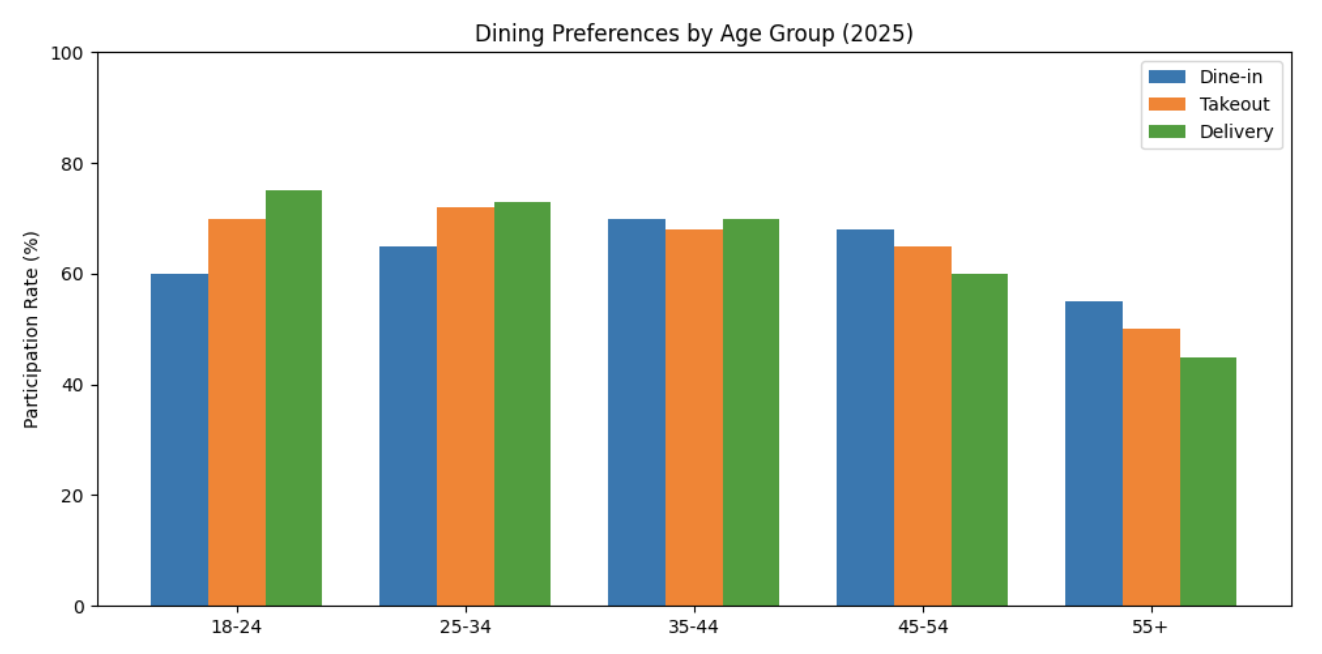
Dining Preferences by Age Group(2025)
This structural shift places new demands on restaurants—not to choose one channel over another, but to deliver consistent experiences across multiple entry points.
Cost Structure Shifts: What’s Squeezing Restaurants Today
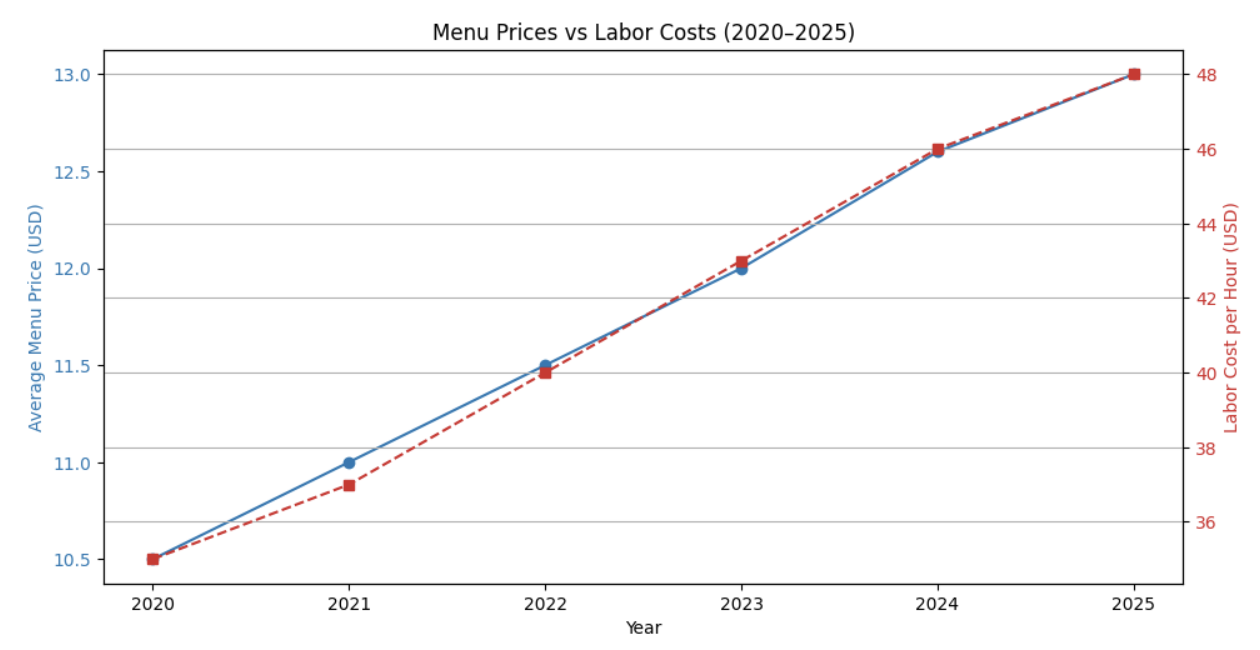
Menu Prices vs Labor Costs (2020-2025)
From 2021 onward, U.S. restaurants have faced sustained cost pressure across labor, food inputs, and operations.
Key data trends show:
- Labor costs rising at a structurally higher rate (BLS)
- Menu prices increasing, but within limited consumer tolerance
- Margin recovery lagging behind revenue growth
This creates a critical inflection point:
Cost control is increasingly determined by operational discipline rather than pricing power.
Operational Friction: Where Guest Experience Actually Breaks Down

Top Customer Friction Points
According to Deloitte and PwC customer experience studies, most guest dissatisfaction does not originate from food quality, but from process breakdowns, including:
- Excessive wait times
- Order inaccuracies
- Communication gaps
- Repeated confirmation or clarification
These issues may appear manageable during off-peak hours, but they escalate rapidly during high-volume periods, compounding stress for staff and frustration for guests.
Operational friction, once accumulated, directly impacts:
- Online ratings
- Repeat visitation
- Staff burnout and turnover
Case Analysis: When Growth Meets Structural Pressure
Across multiple industry benchmarking reports, a recurring pattern emerges:
A restaurant experiences demand recovery and revenue growth—but also:
- Higher peak-time workload
- Increased employee fatigue
- More fragmented guest feedback
- Greater reliance on managerial intervention
Research from Toast and Square describes this phenomenon as “structural friction spillover”—where growth amplifies inefficiencies rather than improving outcomes.
Growth alone does not guarantee better performance.
Only growth supported by resilient operating structures translates into sustainable returns.
Key Trends for 2026: What Will Separate Strong Operators from the Rest
Based on the aggregated data and case analysis, three trends stand out for 2026:
✅ Efficiency Is Becoming a Stability Metric
✅ The Floor for Guest Experience Is Rising
✅ Structural Capability Is Replacing Individual Heroics
Conclusion: Rebalancing, Not Expanding
The U.S. restaurant industry is not entering a downturn—it is entering a more selective, disciplined phase of competition.
In this environment:
- Success does not come from doing more, it comes from doing fewer things incorrectly
- Not from being busier, But from being more stable
FAQs
❶ Why is operational friction becoming more important than overall sales growth?
As the report shows, total U.S. restaurant sales are still growing (Figure 1), but the margin for error is shrinking.
Operational friction—like order inaccuracies, wait times, and communication breakdowns (Figures 6 & 8)—directly impacts repeat visits, guest satisfaction, and employee productivity. Simply adding more staff or expanding hours often fails to reduce friction, and may even increase costs. Successful operators focus on absorbing demand without increasing errors.
❷ Are consumers really using multiple ordering channels simultaneously?
Yes.
Data from PwC and McKinsey (Figures 2 & 4) show that most diners alternate between dine-in and off-premises orders depending on context. Many guests dine in for social/experiential occasions and order takeout or delivery for convenience. Restaurants must design consistent service experiences across channels to avoid dissatisfaction.
❸ How do labor costs and menu price inflation affect profitability?
Labor costs have risen steadily (Figure 7), while menu price increases are limited by consumer sensitivity (Figure 5). This combination compresses profit margins, making operational efficiency and error reduction more important than revenue growth alone. Restaurants that fail to manage labor and workflow effectively risk losing more to friction than they gain from additional sales.
❹ Is investing in high-tech solutions the only way to reduce friction?
Not necessarily.
The report emphasizes structural capability, which can include technology, process design, training, or staffing models. The key is consistent, repeatable performance at peak hours. For example, standardizing order-taking procedures or redesigning kitchen flow can yield significant improvements even without heavy tech investment.
❺ Which friction points have the biggest impact on guest experience?
Based on Deloitte and PwC studies (Figures 6 & 8), the top friction points are:
- Long wait times
- Order inaccuracies
- Miscommunication
- Repeated confirmations
These points compound during peak periods, increasing stress on staff and negatively affecting guest satisfaction.
Addressing them systematically is more effective than focusing on isolated improvements.
❻ How should restaurant operators prioritize actions in 2026?
Three priorities emerge from the report:
- Stabilize efficiency – reduce errors and variability, especially during peak hours.
- Protect core experience – avoid mistakes that guests notice, even if delight features are limited.
- Strengthen operating structure – invest in workflows, training, and tools that improve consistency across channels.
The overall principle is rebalancing efficiency, experience, and structure, rather than chasing growth at all costs.
About Tunvo AI

Tunvo is an AI voice agent for restaurants.
It answers every call, takes orders straight into your POS, and helps restaurants boost revenue by capturing every inbound opportunity. So your teams can focus on delivering exceptional guest experiences.
Data Sources and References (Selected)
- National Restaurant Association – State of the Restaurant Industry
- U.S. Bureau of Labor Statistics (BLS)
- McKinsey & Company – The Future of Dining
- PwC – Future of Customer Experience
- Deloitte – Hospitality Consumer Signals
- OpenTable – Dining Trends Report
- Federal Reserve Economic Data (FRED)
- Toast & Square – Restaurant Benchmarking Reports