Most restaurant menus carry dead weight. There’s usually a handful of dishes — maybe more than a handful — that have been on the menu for years, rarely ordered, tying up ingredients that spoil, taking up kitchen prep time, and consuming menu real estate that could be doing more. Owners know these items exist. Cutting them is harder than it sounds.
Menu engineering is the discipline that makes this decision data-driven instead of emotional. By combining two simple metrics — how often an item is ordered and how much profit it generates — you can classify every dish on your menu and make removal, repricing, or promotion decisions with confidence. The process doesn’t require specialized software. It requires your POS sales data, a spreadsheet, and about two hours.
This guide walks through the full menu engineering process, explains the four-category matrix, and covers what to do with each type of item — including how to handle the items you’re emotionally attached to but the data says should go.
Key Takeaways
- Menu engineering combines two metrics: contribution margin (profit per dish) and popularity (order volume) to classify every item into one of four categories — Stars, Plow Horses, Puzzles, and Dogs.
- Dogs should usually be removed — they consume ingredients, prep time, and menu space without sufficient return. Most restaurants can eliminate 15–20% of their menu items without customers noticing.
- Plow Horses are your volume drivers but margin problems — the classic case for recipe reformulation or careful repricing.
- Menu engineering can boost profitability by 10–20% when combined with menu design changes that highlight high-margin items.
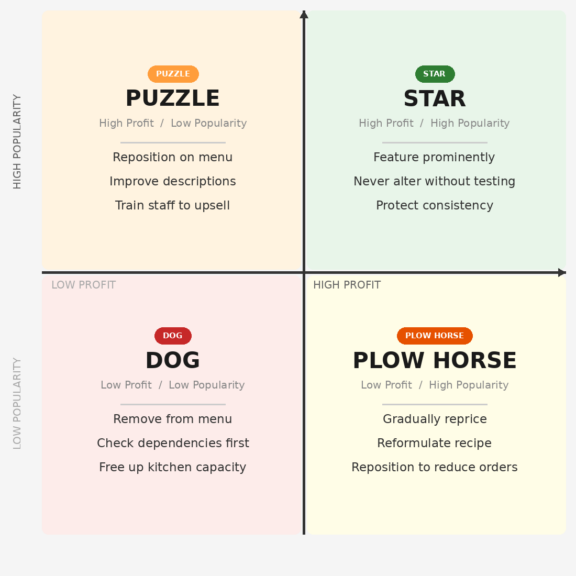
The Four-Category Menu Engineering Matrix
Stars: High profit, high popularity
Stars are the items every restaurant wants more of — dishes customers love, order frequently, and that generate strong contribution margins. These are your menu’s most important items, and the biggest mistake you can make with them is over-engineering them. Your primary job with Stars is protection: ensure consistent execution and keep these items visible. Feature them with compelling descriptions and highlight them visually in prime menu positions.
Don’t significantly alter the components of star dishes, and don’t move them to less visible menu positions. Stars should be where customers’ eyes land first within their category.
Plow Horses: High popularity, low profit
Plow Horses are the trickiest category. These are dishes customers love and order constantly — but your margin on them is thin. They’re often legacy items from when ingredient costs were lower, or dishes that got repriced too conservatively over the years.
The options for Plow Horses are: raise the price carefully (testing customer sensitivity), reformulate the recipe to reduce ingredient cost without noticeably changing the dish, or reposition the item on the menu to reduce ordering frequency while focusing attention on higher-margin alternatives. Abruptly removing a Plow Horse is usually a mistake — customers notice the absence of a beloved item. A gradual price increase of $1–$2 per repricing cycle is a better path.
Puzzles: High profit, low popularity
Puzzle items are profitable but underordered. The dish has good margins — it just isn’t getting enough attention. Before treating a Puzzle as a failure, look at why it’s not selling: Is it buried on the menu? Does it have a weak description? Is the price creating a perception mismatch (too expensive for what the name suggests, or not clearly positioned as premium)?
For Puzzle items, menu repositioning, better descriptions, and server recommendations can boost their popularity without increasing the cost to make them. A Puzzle item promoted to Star status is one of the most profitable outcomes in menu engineering.
Dogs: Low profit, low popularity
Dogs are neither profitable nor popular. The best and most common solution for Dog items is to remove them from the menu — this step saves costs and ingredients for other dishes, and helps cut overall expenses. Keeping Dogs on the menu requires purchasing their ingredients (which may spoil before use), training staff on their preparation, and dedicating menu space that could showcase something that actually sells.
The emotional difficulty is that Dogs often have a history. The dish a previous owner loved, the special someone’s grandmother used to make, the item that sold well five years ago. Removing it feels like a loss. The data perspective is clearer: if fewer than 2–3% of customers are ordering a dish, and its contribution margin is below average, the menu is better without it.
How to Run a Menu Engineering Analysis
Step 1: Pull your sales data
Most POS systems can export a menu mix report — a list of every item sold, with quantities and revenue, over a selected period. Choose a representative time frame: at least 30 days, ideally 90 days. Avoid periods that include unusual events (major holidays, renovations, temporary closures) unless they represent your normal operating reality.
Step 2: Calculate contribution margin for each item
Contribution margin = selling price − cost of ingredients (portion cost). You need accurate recipe costing for this step. If you don’t have it, start there — it’s impossible to evaluate profitability without knowing what it costs to make each dish.
Once you have contribution margins, calculate the average contribution margin across all items. Items above that average are classified as “high profit” for the matrix; below average is “low profit.”
Step 3: Determine popularity threshold
The standard popularity benchmark uses a formula: expected popularity = (1 ÷ number of items in category) × 70%. The 70% multiplier accounts for the natural variance in how items sell. For a category with 10 items, expected popularity per item is 7%. Items ordered more than that threshold are “high popularity”; less than that is “low popularity.”
Analyze by category — appetizers, mains, desserts — rather than across the whole menu, since volume benchmarks differ significantly between categories.
Step 4: Plot your matrix and classify
| Category | Profit | Popularity | Recommended Action |
|---|---|---|---|
| ⭐ Star | High | High | Protect, feature, never alter without testing |
| 🐴 Plow Horse | Low | High | Reformat recipe, gradually reprice, reposition |
| 🧩 Puzzle | High | Low | Reposition on menu, improve description, upsell |
| 🐕 Dog | Low | Low | Remove from menu unless special circumstances apply |
Practical Considerations Before You Cut
Check for hidden dependencies before removing a Dog
A market basket analysis — examining which items are commonly ordered together — can make the case for keeping a low-profit item on the menu if it’s consistently ordered alongside a high-profit item. A dim sum side dish that’s barely profitable on its own might be ordered by 80% of customers who also order the restaurant’s highest-margin entrée. Removing it without understanding that dependency would be a mistake.
Look for item combinations in your POS data before making any removal decisions.
How many items should a restaurant menu have?
The “paradox of choice” is real in restaurant menus — too many options slow decision-making, increase anxiety, and reduce average ticket size. Research consistently shows that TGI Fridays famously reduced their menu from over 90 items to around 60, and same-store sales increased 2.5% within a year. Most independent restaurants can cut 15–25% of their menu items and see both operational simplification and customer experience improvements.
How often should you re-run the analysis?
Quarterly is appropriate for most restaurants. Monthly if you’re in a high-volatility ingredient environment and need to catch margin erosion early. After any significant price increase or menu addition, re-run the analysis to see how customer behavior has shifted.
The Role of Phone Orders in Menu Analysis
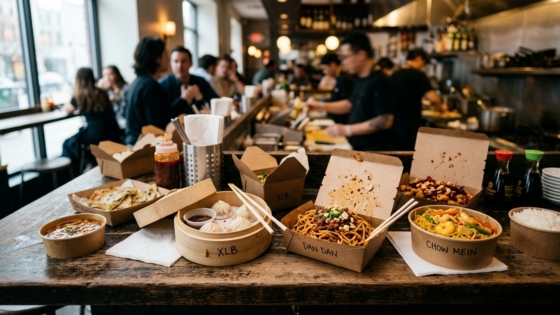
One data gap that many restaurant owners don’t account for: phone orders often aren’t fully captured in POS menu mix reports if they’re being entered manually by staff. If your phone order volume is significant — as it is for most Chinese takeout and delivery-focused restaurants — you may be running your menu engineering analysis on incomplete data.
An integrated phone ordering system that routes calls directly to your POS fills this gap. Tunvo’s AI voice agent captures phone orders directly into your MenuSifu POS, which means every phone order is counted in your sales data — giving you a complete picture of what’s selling and what’s being ordered by phone-first customers, who often have different preferences than walk-in traffic.
For restaurants doing substantial phone-order volume, running menu engineering without this data means making menu decisions based on only part of the picture. Understanding the full picture of your order mix is what makes the analysis actionable rather than approximate.
Frequently Asked Questions
How do I calculate food cost percentage for each menu item?
Food cost percentage (FCP) = (ingredient cost per serving ÷ menu price) × 100. If a dish costs $8 in ingredients and sells for $25, the FCP is 32% — within the healthy 28–35% range. Track this for every item in your menu engineering spreadsheet alongside contribution margin and order count.
Should I tell customers when I’m removing a popular dish?
If it’s a Plow Horse you’re deliberately scaling back to reduce ordering frequency, you probably don’t need an announcement. If it’s a genuinely beloved item you’re removing for operational reasons, a brief acknowledgment — on social media or via a message to loyalty customers — goes a long way. Customers who feel considered are more forgiving than customers who feel surprised.
What if my POS system doesn’t generate menu mix reports?
This is a signal to evaluate your POS system. Manual tallying from receipts works for very small menus but becomes impractical at scale. Most modern POS platforms — including MenuSifu — provide built-in sales mix reporting. If yours doesn’t, that’s worth addressing independently of menu engineering.
Can menu engineering help with phone ordering, or just in-person?
Menu engineering insights apply to all order channels. If your analysis reveals that certain items are underordered by phone customers versus in-person diners, that’s a signal about how those items are being presented verbally versus visually. An AI voice agent can be configured to present and upsell specific items during phone orders — effectively applying your menu engineering decisions to the phone channel automatically.
Menu engineering tells you what to keep, cut, and promote. But if a third of your orders come through the phone and those calls go unanswered, no amount of menu optimization will capture that revenue. Tunvo answers every call, takes every order, and logs it directly in your MenuSifu POS. Start your 15-day free trial or book a demo.